When I asked manufacturers this year which areas get too little attention, nature and biodiversity came out as the clearest gap: 55% said so (survey write-up). I didn't ask specifiers about nature at all, which in hindsight says something about where my own attention was.
Others are already acting. From 2028, Green Star's Nature Positive Pathway asks projects seeking 6 Star to show a 10% net gain in biodiversity, or no net loss on greenfield sites, and all projects are to report nature-related metrics in line with the Taskforce on Nature-related Financial Disclosures (TNFD) (GBCA release). Under the Kunming-Montreal Global Biodiversity Framework, governments have agreed to take measures so that large companies, in particular, monitor and disclose their risks, dependencies and impacts on biodiversity, supply chains included (Convention on Biological Diversity). So the question for a specifier is a practical one: when a product carries a label, which part of nature does that label ask about?
By label I mean anything that shows what a product, or a forest, mine, plant or company in its supply chain, meets or discloses: ecolabels, environmental product declarations (EPDs), product carbon footprints, other declarations, and certifications of the forests, quarries and plants that materials come from. The map holds 109 labels that apply to construction products.
Where the main nature impacts are
Building products start with extracting land, rock and forest, and the scale is large. Non-metallic minerals, such as sand, gravel, clay and limestone, are the largest group of materials the world extracts: about 45 billion tonnes in 2020, close to half of all extraction (UNEP International Resource Panel). On a separate UNEP estimate, the world uses around 50 billion tonnes of sand and gravel a year, the largest volume of any solid material extracted (UNEP 2019), and taking them from rivers and coasts can harm the ecosystems around them (UN News).
Forests are part of it too. The world still loses about 10.9 million hectares of forest a year to deforestation, on average over 2015–2025 (FAO), and the UN Environment Programme's International Resource Panel names wood-related industries, forestry and construction, among the few sectors responsible for most biodiversity loss, with forestry accounting for about 23% of land-related biodiversity impacts (UNEP International Resource Panel).
Mining is small in area and large where it happens. Globally it accounts for under 1% of land-related biodiversity impacts, but the same report notes it can be locally important (UNEP International Resource Panel). In the Brazilian Amazon, mining caused about 9% of forest loss between 2005 and 2015, with effects reaching up to 70 km beyond the mine leases (Sonter et al. 2017), and across 26 tropical countries, some 3,264 km² of forest was lost directly to industrial mining between 2000 and 2019 (Giljum et al. 2022). Bauxite and iron ore, the starting points for aluminium and steel, are among the minerals behind it (Giljum et al. 2022; Sonter et al. 2017). The cement industry's own quarry guidelines put it plainly: extraction "inevitably has an impact on the surrounding natural and social environment" (GCCA guidelines).
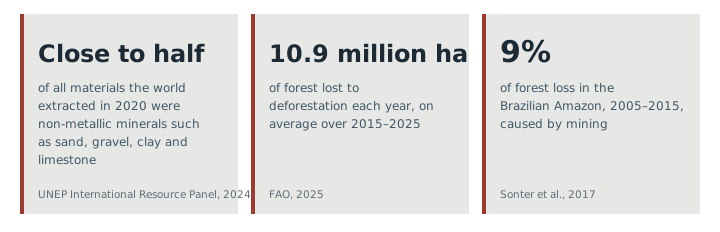
None of this is a figure for any one product, and I'd be careful with the headline numbers that circulate. The often-quoted claim that resource extraction causes 90% of biodiversity loss comes from the Resource Panel's 2019 report. Its 2024 edition puts over 90% of land-use related biodiversity loss on growing and harvesting crops and timber, not on quarrying or mining (UNEP International Resource Panel; UNEP IRP 2019). For a building product, what matters is where its supply chain touches nature: the forest, the quarry, the mine or the factory's discharges.
What I mean by nature
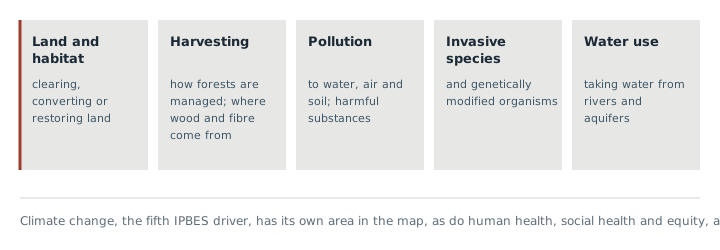
The Intergovernmental Science-Policy Platform on Biodiversity and Ecosystem Services (IPBES) names five direct drivers of nature loss: changes in land and sea use, direct exploitation of living things, climate change, pollution and invasive species. On land and in freshwater, land-use change has had the largest relative impact since 1970 (IPBES).
Klar Cite sorts requirements into five areas, following mindful MATERIALS' Common Materials Framework (CMF): human health, climate health, circular economy, ecosystem health, and social health and equity. Climate already has its own area, so nature here covers the other four drivers, plus water use, which TNFD counts under resource use (TNFD Recommendations, pp. 31 and 86) and the Science Based Targets Network sets targets for in its own right (SBTN). Human health is about the people exposed to the product, social is about the people who make it, and nature is about the land, water and living things affected by how its materials are sourced and made.
Why nature is harder than carbon
Greenhouse gas accounting and carbon footprinting are well established and familiar. Climate change happens in one shared atmosphere, so a tonne of carbon dioxide counts the same wherever it's emitted, and emissions can be added up along a supply chain (TNFD Recommendations, pp. 14 and 21). Nature is harder. As TNFD puts it, nature-related impacts and dependencies "are location specific" (TNFD Recommendations, p. 14). A hectare cleared beside a sensitive wetland is a different loss from a hectare of degraded farmland, and the materials in one building can come from forests and quarries on several continents. Unlike global warming potential, there is no single number to add up either. TNFD finds no single metric that captures all the dimensions of change in nature, and no agreed framework comparable to the Greenhouse Gas Protocol for measuring and reporting it (TNFD Recommendations, pp. 21 and 87; TNFD LEAP guidance, p. 85).
Life cycle assessment has struggled with this for years, and reviews in 2020 and 2023 report the same gaps (Crenna et al. 2020; Damiani et al. 2023). A 2023 review by European Commission researchers screened 64 methods for assessing biodiversity impacts, in LCA and beyond, analysed 23 in depth, and found none that performs well on all criteria, with pressures such as overexploitation and invasive species largely missing (Damiani et al. 2023). Methods are improving: in 2024 the UNEP-hosted Life Cycle Initiative released a global method that includes damage to ecosystem quality, with country-level factors for land use and water (Life Cycle Initiative; Ecosystem Quality summary). For now, though, EN 15804+A2, the standard behind construction EPDs, has no core indicator that measures biodiversity directly. Land does enter an EPD, as emissions from land use and land-use change and an optional soil quality index, but impacts on habitat and biodiversity at the forest or quarry the material came from can at best be inferred indirectly (EPD International; EPD-Norge template).
Nature has no voice of its own in a supply chain, and this is where labels step in. A label that asks about the forest, the quarry or the effluent makes what happens at the source visible to the buyer, and makes someone accountable for it. Declarations make information visible, and certifications set requirements and check them. Both put nature into a purchasing decision, which is why it matters what they ask.
Labels watch pollution more than land
At least 84 of the 109 labels set one or more requirements about nature. Sorted by driver, fewer than I expected address land and habitat: whether a forest, quarry, mine or plant may clear or convert natural habitat or operate in a protected area, how it protects biodiversity on and around its site, and how the land is restored after extraction.
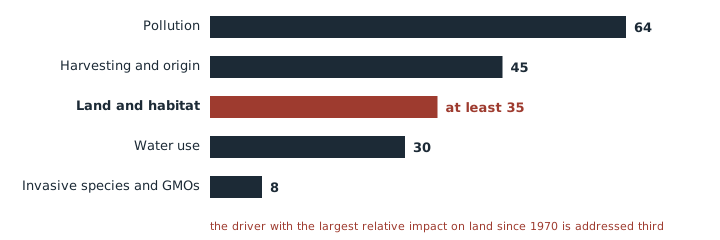
Pollution comes first: 64 labels set requirements on discharges to water, emissions to air, soil contamination, harmful substances or agrochemicals. Harvesting and origin come next (45), from how a forest is managed to rules that wood and fibre come from legal or certified sources. Land and habitat, the driver with the largest relative impact on land since 1970 (IPBES), is addressed by at least 35, followed by water use (30) and invasive species and GMOs (8).
Where to draw the line between land and origin is a judgement. Rules that wood must come from forests not converted from natural habitat could count as land as well as origin; counting them that way lifts land and habitat to around 40, and it still comes third.
How the requirements are framed is mixed. Qualitative obligations (61 labels) and numeric limits (54) lead, 38 labels set an outright ban, and measurement comes last, in 14.
One example: a forest standard that addresses all five drivers
Responsible Wood, which is endorsed by PEFC (Responsible Wood), certifies forest managers to its standard for sustainable forest management, AS/NZS 4708:2021 (Responsible Wood). In my reading, it is one of four labels in the map that address all five drivers, with the Sustainable Forestry Initiative's forest management standard and two textile standards:
- Land and habitat: no conversion of native vegetation to plantation after 31 December 2006, with stated exceptions (11.1.3), and significant biodiversity values identified, maintained and monitored, including habitat connectivity across the landscape (11.3);
- Harvesting: a harvest rate in line with the forest's long-term productive capacity, and reforesting after harvest (11.5.2, 11.1.5);
- Pollution: integrated pest management and documented risk assessments for pesticides (11.2.3, 11.2.4);
- Invasive species: identified and brought under control within the forest (11.2.2);
- Water: soil and water values assessed and protected, such as drinking water catchments (11.4.1, 11.4.3).
Where land and habitat sit
Land and habitat sit mostly with the labels that certify where materials come from. As you'd expect, 14 of the 15 labels for forests, steelworks, aluminium operations and concrete plants address them (93%). Of the 76 ecolabels and other product certifications, only 17 do (22%), mostly in one or two requirements on quarries and mines: rehabilitating the land after extraction, a biodiversity plan at the extraction site, or keeping out of protected areas. What product labels watch most often is pollution: effluent, air emissions and harmful substances.
That share may look worse than it is, for two reasons. Part of it may be scope: a label may not see land as material for the product category it certifies, for example where the raw material is recycled. And a level down: 17 of the 76 set a rule that wood or fibre in the product come from forests certified to FSC, PEFC or the Australian Forestry Standard, usually alongside other accepted sources such as recycled or plantation fibre. Where the wood does come from a certified forest, that forest's standard sets its own requirements on land and habitat, as every forest management standard in the map does. Scope doesn't explain all of it, though: two of the seven ecolabels written for concrete, cement and stone don't address land and habitat.
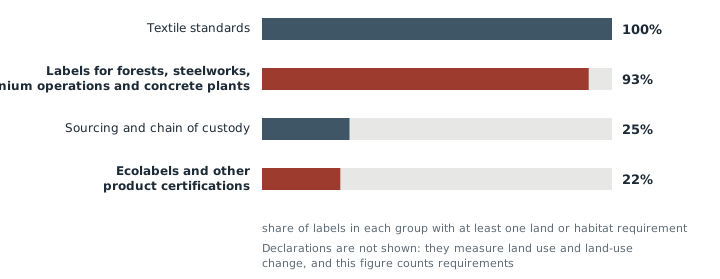
Declarations take a different route. Under EN 15804+A2, an EPD reports core indicators including acidification, three kinds of eutrophication and water deprivation, which is measurement with no pass mark, and leaves the judgement to the reader (EPD International). Land is measured the same way. An EPD reports emissions from land use and land-use change as a core indicator and can add a soil quality index (EPD-Norge template, p. 7). A product carbon footprint under ISO 14067 counts emissions and removals from direct land-use change (ISO 14067:2018, 6.4.9.5), and the PACT methodology for carbon footprints sets out how to calculate land occupation (PACT Methodology, 3.3.2.5.1). That is why declarations aren't in Figure 4: they measure land use, while the figure counts requirements on land and habitat. Klar Cite doesn't yet hold most EPD indicators, such as acidification, eutrophication and the soil quality index, as requirements, so they aren't in these counts.
A requirement count is not a measure of rigour. A standard for a forest is written requirement by requirement, while an ecolabel can cover a quarry in one sentence that asks for a rehabilitation plan.
One example: land and habitat at the mine
For products where land and habitat are a material risk, this is what requirements can look like. In my reading, the Aluminium Stewardship Initiative's Performance Standard (V3.1) sets 21 requirements on land and habitat at the operation it certifies, and that operation can be the bauxite mine itself (ASI):
- assessing risks to biodiversity and ecosystem services across the operation's area of influence (8.1);
- a published biodiversity action plan with time-bound targets, following the mitigation hierarchy with an ambition of no net loss (8.2);
- no new projects in World Heritage properties, and no exploring or mining in protected areas unless a set of exceptional conditions is met, including an independent third-party assessment (8.5, 8.6);
- a mine rehabilitation and closure plan, with progressive rehabilitation and money set aside for closure (8.7).
How far back it looks
Most land-related biodiversity loss happens at the start of the value chain, where resources are grown, harvested and extracted, before materials reach a factory (UNEP International Resource Panel). For a building product that is several steps back, and often out of sight, so it matters whether a label's requirements reach back. In my reading, nature requirements reach further back than social ones. Of the 84 labels with nature requirements, 69 have at least one that reaches suppliers or the sources of raw materials. In my last piece, read on an earlier build, it was 47 of the 68 labels with social requirements.
Most of the 69 are ecolabels and other product certifications (52 of the 57 with nature requirements), plus all eight sourcing and chain-of-custody standards. Only 6 of the 15 forest and plant certifications reach beyond their own site. For a forest, or a mine or quarry where that is the site certified, the site is where the material comes from. Rules that wood or fibre come from certified forests count as reaching back, and for 7 of the 52 product certifications they are the only way their nature requirements do. Pollution is followed back less often: 33 of the 64 labels that address it have a pollution requirement beyond the certified site.

Regulation is pulling the same way. From 30 December 2026, the EU Deforestation Regulation requires wood placed on the EU market by large and medium operators to be deforestation-free since the end of 2020, backed by due diligence (European Commission; dates). And one of TNFD's core metrics asks companies what share of their high-risk natural commodities is sourced under a sustainable management plan or certification programme (TNFD Recommendations, p. 86).
One example: a product label that reaches back to the mine and the smelter
Eco Choice Aotearoa's standard for aluminium building products (EC-62-25) is a product ecolabel, and in my reading 15 of its 17 nature requirements reach beyond the licence holder's own site (Eco Choice Aotearoa). They include:
- management plans requested from the bauxite quarries, including a biodiversity management plan for the mining site (5.5.1);
- information on air emissions from the primary smelter, including fluorides, sulphur dioxide and polycyclic aromatic hydrocarbons (5.9.2);
- controls at the smelter on storage, spills and water discharges (5.6, 5.9.1);
- water management with the smelter, reported each year (5.10).
One product: stone and concrete
Stone and concrete start in the ground, in the sand, gravel and limestone that make up so much of what the world extracts, so they are a fair test of whether a label reaches the quarry.
Fourteen labels in the map are written for concrete, cement, aggregates or stone, of two types.
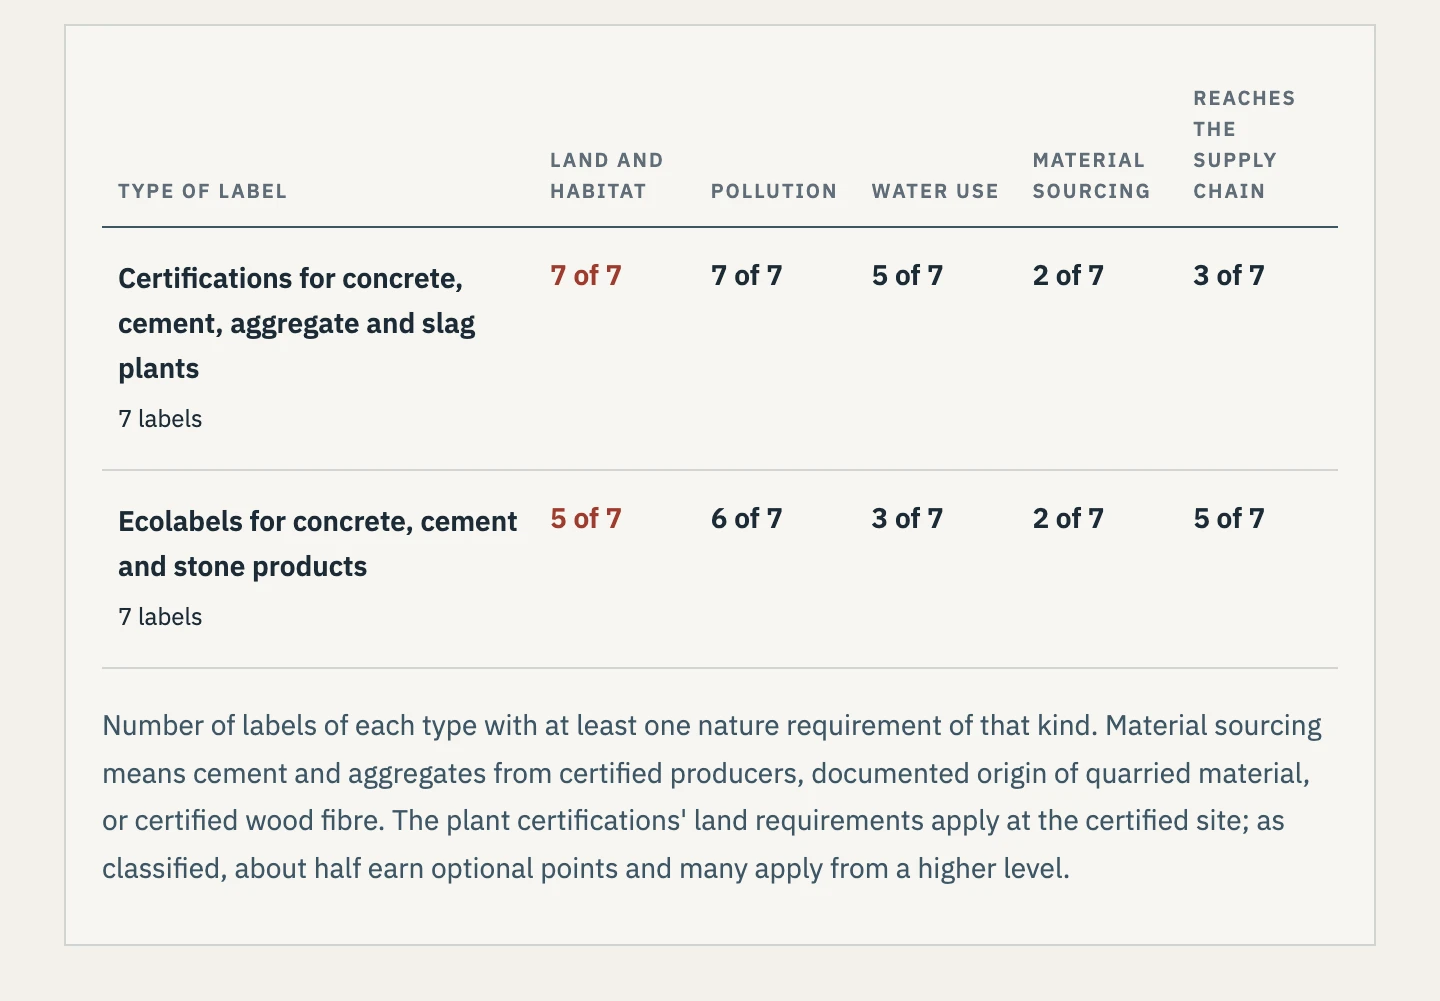
The seven certifications for concrete, cement, aggregate and slag plants certify the site that makes the material and how it's run. All seven address land and habitat, nearly all of it at the certified site: a public biodiversity policy, an impact assessment before extraction, a policy against operating where land use is contested, and voluntary actions for nature. As classified, about half earn optional points and many apply only from a higher level, though each certification has at least one classified as mandatory. They also cover pollution and, in most cases, water use. Where the site sits in the supply chain matters. For a marine aggregates operation, the certification covers the dredging sites themselves. A recycled aggregates plant has no quarry behind it, since its raw material is mostly construction and demolition waste. Slag is a by-product of iron and steel making, and the scheme rewards slag from certified sources with optional points. A concrete plant's land and habitat requirements apply at the plant. It earns optional points for cement and aggregates from certified suppliers at any level, and at the highest level, Platinum, 75% of each must come from suppliers certified by the same scheme.
The seven ecolabels for concrete, cement and stone products certify the product and the factory that makes it. They concentrate on pollution: air emissions from the kiln and plant, dust and effluent, a few of them at the quarry, which together make up more than half of their nature requirements. Five of the seven address land and habitat, as a quarry restoration or rehabilitation plan or a biodiversity condition.
None of this says one label is better than another. The type of label tells you where the checks sit: one about the plant and its land, the other about the product and the factory that made it. Whether either reaches back to the quarries and mines behind the product varies label by label: three of the seven plant certifications and five of the seven ecolabels have a nature requirement that does.
Rating tools, in passing
Rating tools work at the scale of the building site. Green Star has Nature credits for Impacts to Nature, Biodiversity Enhancement, Nature Connectivity and Nature Stewardship (GBCA), and the Nature Positive Pathway described above (GBCA release). The Living Building Challenge's Place Petal includes the Ecology of Place and Habitat Exchange imperatives (Living Building Challenge). LEED v5 has a Biodiverse Habitat credit, and two of its elements reach products: bird-friendly glass, and imported soil that doesn't come from greenfield sites or contain sphagnum peat (USGBC). In BREEAM (UK New Construction 2018), the land use and ecology issues sit at site level (BRE). They decide what counts towards a building's rating rather than what a product must meet to be certified, so I keep them apart from these counts.
Progress on forests, policy and quarries
There is progress, much of it recent. Deforestation has slowed from 17.6 million hectares a year in the 1990s to about 10.9 million in the last decade (FAO). Forest certification covers a large area: about 296 million hectares certified to PEFC at the end of 2025 (PEFC) and about 173 million to FSC, on figures it displayed in September 2026 (FSC) (some forests hold both, so the two don't add up).
Policy and reporting are catching up. In October 2026, the Convention on Biological Diversity (CBD) reported that nearly 90% of its 196 Parties had set national targets under the Global Biodiversity Framework, but that fewer than half of the national targets Parties have assessed are on track (CBD). The CBD's July 2026 review counted more than 5,000 companies disclosing biodiversity-related risks in the countries reporting on business disclosure, and warned that the 2030 targets won't be met without faster action (CBD). The EU Deforestation Regulation turns deforestation-free sourcing into a legal test for wood (European Commission). In 2024, a building materials company was among the first to adopt validated science-based targets for nature (SBTN), and in Australia the first four Nature Repair projects have been registered, although no biodiversity certificates had been issued as at 9 October 2026 (Clean Energy Regulator).
The materials industries are moving too, by their own account. The cement and concrete industry's global association asks members to plan quarry rehabilitation and manage biodiversity at quarries of high biodiversity value, and aims for a net positive impact, while acknowledging in its biodiversity policy that the net effect "has not been measured routinely" (GCCA guidelines; GCCA policy). It also points to future EPDs that include biodiversity indicators (GCCA policy). In the UK, the industry's trade association reports that its sector has created more than 90 km² of priority habitat, with more planned (Mineral Products Association).
These are measures of effort and management more than of outcomes, and much of the reporting is the industries' own. They are still the direction labels can follow.
If a label can't cover it all, make sure it covers what matters most
If you specify a certified product, you'd expect its impacts on nature to have been assessed, and nature protected. Most labels watch some parts of nature more closely than others, though, so for now it pays to decide what matters most for the product you source. That depends on where its materials come from and how it's made:
- If it's water, air and other pollution from making the product, most labels with nature requirements say something about it, but only about half of them follow it beyond the certified site (33 of the 64 that address pollution).
- If it's the forest, as it often is for timber and fibre, look for a forest certification, or a chain of custody that traces certified material back to one, as FSC, PEFC, Responsible Wood and SFI do. Some ecolabels build this in, so the forest certification sits one level down: 17 of the 76 ecolabels and other product certifications in the map name FSC, PEFC or the Australian Forestry Standard in their rules for wood or fibre.
- If it's the quarry or the mine, as for stone, concrete and metals, expect few product labels to ask, and look for a certification that covers the extraction site itself. The Aluminium Stewardship Initiative's standard above can, where it certifies the mine. A concrete plant certification sets its land and habitat requirements at the plant, and rewards cement and aggregates from certified suppliers, which it requires only at the highest level.
Labels can be very powerful, and do the hard work of looking deep into diverse supply chains. Where a label asks about the forest or the quarry, it's how what happens there reaches the person choosing the product. It is still a starting point: IPBES describes the effectiveness of voluntary certification as mixed and often contested (IPBES), and no count of requirements changes that. With Klar Cite, "low impact" on a logo becomes the requirements behind it, where the scheme allows them to be shown, so you can see which part of nature a label covers before you open the standard.
When you specify stone or concrete, check whether its label addresses how the quarry is managed and how it will be restored. It isn't guaranteed, because not every label goes to that level for nature.
How this was mapped
Klar Cite register, build 2026-10-22-0117, the build the app serves, current editions. The broad areas are my judgement from a requirement-by-requirement assessment. All 2,183 clauses assessed mainly to ecosystem health on the preceding research build (2026-10-17-0230) were re-read one by one by model readers for this piece and sorted by driver, framing and reach, with a blind re-read of a sample and a verifier's own sample of 20. The readings were carried to the served build where a clause's wording is unchanged, or only lengthened or shortened (2,077 clauses); the 106 reworded or replaced in that build were not carried. The drivers follow IPBES, with water use added and climate left to its own area; the grouping of each kind of requirement under a driver is mine. Requirements assessed to nature only as a secondary area, and clauses new to the served build, were not read, so the counts of labels are a floor. A label counts once however many of its requirements qualify. The social comparison is from build 2026-10-11-0932. The stone and concrete labels were selected by name. Textile standards are included. A count of requirements is not a measure of rigour.
Method and sources: Klar Cite register, build 2026-10-22-0117 (served), analysed on research build 2026-10-17-0230 and re-run on the served build. Web pages and documents accessed 17, 25 and 26 October 2026. Survey figures from my 2026 specifier and manufacturer surveys (survey write-up).